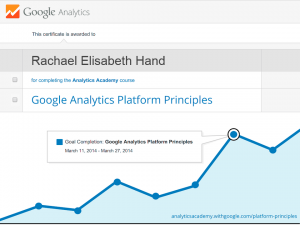
If you’re at all familiar with our blog then you may well have come across our post on The Google Analytics Academy.

Google Analytics Platform Principles: Basics
There are four main platform components to Google Analytics that work together to provide you with the data you see in your dashboard, these are: collection, processing, configuration and reporting. To collect data from a website you use the JavaScript tracking code, to collect data from a mobile app you use an SDK (software development kit) code and to collect data from any other web accessible device such as an appliance or till point you need to build your own reporting API. Processing and configuration work together, with the configurations you set determining how your data is processed. You can also link external data (not collected by your tracking code) from Adwords, Adsense and Webmaster Tools as well as uploading data from non-Google platforms.
The Data Model
The data model Google Analytics uses follows a hierarchy of Users, Sessions and Interactions. “Users” displays data about the visitors to your site, “sessions” displays data concerning the time spent on your site and “interactions” shows data concerning what they did during their session e.g. pages visited, clicks and so on. It is worth noting that sessions can have single or multiple interactions and that each interaction is packaged up as 1 hit. There are many different types of hit, such as page view, click etc. In other words, depending on your business objectives, not all hits are equal, some will be more valuable to you than others.
Data Collection
Of course if you use Google Analytics you’ll be aware that it can distinguish between new and returning users. It is the tracking code that gathers the info about users behaviour and makes this distinction. Going into a bit more detail on the Google tracking code, everything after the ? is a parameter.
<script type=”text/javascript”> var _gaq = _gaq || [ ]; _gaq.push([‘_setAccount’, ‘UA-2190108-2’]); _gaq.push([‘_trackPageview’]); (function() { var ga = document.createElement(‘script’); ga.type = ‘text/javascript’; ga.async = true; ga.src = (‘https:’ == document.location.protocol ? ‘https://ssl’ : ‘http://www’) + ‘.google-analytics.com/ga.js’; var s = document.getElementsByTagName(‘script’)[0]; s.parentNode.insertBefore(ga, s); })(); </script>
A parameter is a part of the code that carries data, some of these are encoded and others are human readable such as “us-en” which identifies the language of the browser. The tracking code creates hits and identifies new and returning visitors. The tracking ID associates your data to your account.
Website Data Collection
As mentioned, to track a website in Google Analytics (henceforth GA) you need to use the JavaScript tracking code. This code need to be added on to EVERY page of your website that you want to track, to capture all the interactions in a session. It should go before the closing head tags in your HTML file. Placing it here allows GA to capture page visits even if the user leaves before the page has fully loaded.The JavaScript tracking code pulls data both from your website itself and the browser being used to view it. To distinguish between new and returning users it generates anonymous unique identifiers using first party cookies. It does this asynchronously.
Mobile App Data Collection
Data from apps is collected slightly differently to data from websites. It is initially stored locally on the mobile device, before then being sent through to Google Analytics via the SDK code in a batch system known as dispatching. There are different SDKs for each operating system Android and iOS, for android dispatching happens once every 30 minutes for iOS it happens once every 2 minutes although this can be customized. The reason dispatching is used is because mobile devices can frequently loose web connectivity in which case data can’t be sent to GA and without dispatching, sending hits in real time would also have a significant, negative impact on battery life of the device. As on websites, to differentiate new from returning users on apps, an anonymous unique identifier is generated. This happens the first time the app is downloaded and opened = 1 new user. Each time the app is opened after that, any opening with same identifier is recorded as a return visit. However, if the app is uninstalled and then installed again, a new identifier is generated and it counts as a new user.
Measurement Protocol Data Collection
Google Analytics can receive data from any web enabled/connected device, however to do this you must manually build the data collection hits.The measurement protocol dictates how to construct this and how to send the data to GA. It is essential to add a Google tracking ID to every hit you send to GA.
Processing and Configuration
These two core features of the GA platform work together to organize data. Data can be organized into users and sessions. Imported data from internal sources can also be joined with GA data to give a more accurate and complete picture of your performance and this data can be modified according to the configurations you apply to your account. All this is then be aggregated into database tables.
Importing Data in to Google Analytics
So, data can be imported into GA both from the tracking code and other sources. The data from these other sources can be imported through two processes: account linking and data input. Data imported via these methods is processed alongside the data from the tracking code.Within the data input method there are two options, you can either use a precess called dimension widening where by you upload a file to GA or make use of the GA APIs. The other option is to do a cost data import and this is best for data from non-Google ads, to help calculate your return on investment (ROI). These files must include a campaign source and medium and there also needs to be a key. The key is one common element that connects the data in your input and the GA platform.
Processing Hits into Sessions and Users
A session is a collection of hits such as page views, events or eCommerce transactions to name just a view. In GA, one session ends if there is 30 minutes of inactivity. Any activity after that will be counted as a new session. However, for websites such as video hosting sites where inactivity may be expected to be longer than 30 minutes, the length of the session time can be customized.
Transforming and Aggregating Data
The configurations you apply to your data can transform it in ways such as including data, excluding data or modifying how that data appears. The way to transform data and apply configurations in GA is to use filters, and these change the data in the different views. Goals can also be created to transform data by modifying how it is presented. Grouping can be used to aggregate certain pieces of data, for example you could group all the data related to your different channels in to one group and all the data from your content into another group. Configurations are applied before processing and aggregation and once data has been processed it CANNOT be changed! That means it is vital that a.) your data configurations are correct and that b.) you set up a raw data view, with no configurations applied so you can still see the un-manipulated data your website generates.
Reporting Overview
In your GA reports you an create different combinations of dimension and metrics,. Dimensions are the first column values that appear in your GA reports and denote the characteristics of your data such as source, page name etc and metrics are all the other columns, which report quantitative data such as averages, time and counts. You can use the GA APIs to extract data directly, to automate custom reporting and sampling can also be used to retrieve data quicker when necessary.
Building Reports with Dimension and Metrics
However, not every metric can be combined with every dimension. They must belong to the same level. The levels are: session, user and hit (descending order). GA will allow you to create a report combining metrics and dimensions from different levels but the data will ultimately not make sense.
The Reporting APIs
The reporting APIs can be used top integrate data and build custom dashboards in GA. You need to write your own application to do this and all queries much include: a view ID, start and end date for the reporting period, the dimensions and metrics you want to include, and finally the filter, segments and order.
Report Sampling
Sampling is used to create faster reporting by only pulling data from a subset of the whole. You can use custom requests, whereby GA tries to perform your request first by using the data already aggregated there, however, if this cannot be done GA then goes back to the raw data tables. The sample sizes Google operates on can be adjusted. And Ladies and Gents, concludes the lessons we learned during the Google Analytics Platform Principles course. As we said earlier, we don’t think this course has been as practically useful as the previous, Digital Analytics Fundamentals course.
Have you taken both Google courses? If so, let us know what you think about them and drop us a comment!


